| Beef production contributes to climate change, soil erosion, water scarcity while the consumption and the reliance on it contributes to a great deal of health problems and food insecurity. In other words, increasing beef production and consumption worldwide is fast becoming farming problem in the world of 7+ billion. Water getting increasingly scarce and food becoming more and more precious importing vegetables and fruits from far will be progressively challenging for Finland while soaring health costs will burden the society and the government. |
ContentClimate Change |
Climate Change
UNFCCC had once mainly focused mitigation. However, the importance and urgency of adaptation policy have gained collective interests recently as climate change has proven inevitable even if mitigation policy is on track. Recently UNFCCC has come to Cancun Agreements during 2010 United Nations Climate Change Conference affirming that global average temperature will be at least 1.5 degrees higher than pre-industrial level. The Agreements was in fact based on the projection of the fourth assessment report of IPCC, that projected global warming during the 21st century would be ranged from 1.8 to 4.0 degrees 1, which is even higher than what UNFCCC and Cancun Agreements stated.
Two strategies of the climate change policy
The climate change policy today can be categorized into two strategies; mitigation and adaptation. While the effort to reduce greenhouse gases – mitigation — should be continued, the ecosystem including human society would have to seek ways to adjust to the changing climate and to avoid potential dangers from it — adaptation. 2 3 The growing demand on beef is giving burden to global warming mitigation strategy and will continue to worsen the food crisis in near future and make the adaptation more difficult than already expected to be.
Mitigation
Deforestation around the Amazon particularly accelerates global warming and it is mainly resulted from cattle breeding expansion and soybean production. According to studies, 80% of deforestation of the Amazon is happening in Brazil and cattle ranching are the driving reason. 4 Moreover, enteric fermentation from livestock ranching, especially cattle, is the most contributing source of methane that has 12 times higher greenhouse effect than carbon di- oxide. Several studies estimate the amount of methane emitted from ruminants is larger than that from emission from coal mining, landfills, or even gas and oil industry, 5 and therefore reducing demand on beef at large remains crucial to mitigate global warming.
Adaptation
It is estimated that about 15-40% of species will collapse with 2℃ of warming, and the extinction rate will be an half of all species with 4℃. Additionally crop yield will decline substantially as temperature rises over 2℃. 6 Regarding that the temperature already has risen up by 0.8℃ since 1850, human basic needs such as food and energy would be seriously threatened in the near future. The impact will spread into all aspects of human living, and ultimately it will alter the system of our society as a whole.
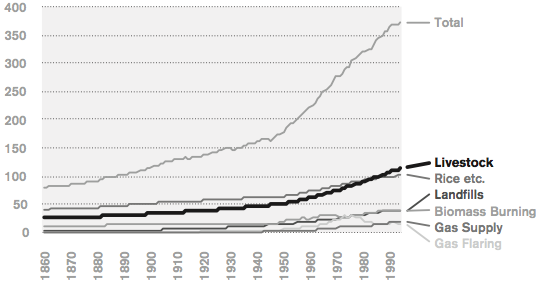
Global Anthropogenic Methane Emissions: 1860-1994, (Stern & Kaufmann)
In a FAO report in 2006, Livestock’s Long Shadow, it is found that livestock are responsible for 18 percent of global greenhouse gas (GHG) emissions, a share higher than that contributed by all transportation. 7 In addition, livestock account for 37 percent of global emissions of methane, a GHG with 23 times the global warming potential (GWP) of carbon dioxide, and 65 percent of emissions of nitrous oxide(NO2), another powerful GHG with 298 times stronger impact ‘per unit 50 weight’ than CO2 considered over a 100-year period. Beef production in particular appears to have greater impact on climate change than any other animal products.

Non-CO2 GHG emissions associated with the production of various food items. Units are 106 CO2-eq yr−1, except column 63 *Source: US Department of Energy 8
It has already been six years after the aforementioned FAO report was published, and the figures widely accepted within the report seem to be somewhat conservative to what is being argued afterwards. In a paper published by a respected US thinktank, the Worldwatch Institute, two World Bank environmental advisers claimed that instead of 18 per cent of global emissions being caused by meat, the true figure is 51 per cent. 9 Robert Goodland, a former lead environmental adviser to the World Bank, and Jeff Anhang, a current adviser, suggested that domesticated animals cause 32 billion tons of CO2-eq., definitely much more than the impact of all transportation, and more than that of industry and energy. Goodland and An- hang argues ‘if this argument is right, it implies that replacing livestock products with better alternatives would be the best strategy for reversing climate change. In fact, this approach would have far more rapid effects on greenhouse gas emissions and their atmospheric concen- trations than actions to replace fossil fuels with renewable energy.’
Other scientists are concerned about livestock’s exhalation of methane, which cows and other ruminants are responsible for 37 per cent of the world’s emission. The Independent reported that a study by Nasa scientists published in Science in 2009 found that methane has signifi- cantly more GWP than previously thought: 33 times more than carbon dioxide, compared with a previous factor of 25. 10
European Peculiarity

EU Total Livestock GHG fluxes EU27: 661 Mt CO2-eq. Total GHG fluxes of EU-27 livestock production in 2004, calculated with a cradle-to-gate lifecycle analysis with CAPRI
In Europe, where dairy consumption per capita is high- er than any other region, meat consumption is not the only contributor to climate change. Total GHG fluxes of European livestock production including land use change emissions amount to 661 Metric Tonne(Mt) CO2-eq. 29% are from beef production, 193 Mt CO2-eq. (29%) from cow milk production and 165 Mt CO2-eq. (25%) from pork production, while all other animal products together do not account for more than 111 Mt CO2-eq. (17%) of total emissions. 11
Tipping point – Vicious Circle of Global Warming
The warming doesn’t happen equally to all the regions. The temperature at the poles is around 4 degrees Celsius warmer than pre-industrial levels — much higher compared to the global average of 0.8, which will melt away permafrost in polar regions, which will all the more ac- celerate global warming due to the darker color of the surface and potentially growing threat of bubbling methane in the Arctic Ocean and Siberian swamps.
One day in 2007, on the plain in northern Alaska, a lightning strike set the tundra on fire. Historically, tundra, a landscape of lichens, mosses and delicate plants, was too damp to burn and no fire of that scale had occurred in the region in at least 5,000 years. But the climate in the area is warming and drying, and fires in both the tundra and forest regions of Alaska are increasing. Scientists say the fire thawed the upper layer of permafrost and set off what they fear will be permanent shifts in the landscape. Up to now, the Arctic has been absorbing car- bon, on balance, and was once expected to keep doing so throughout this century. But recent analyses suggest that the permafrost thaw could turn the Arctic into a net source of carbon, possibly within a decade or two, and those studies did not account for fire. 12
Land
Cattle raising has been criticized for its role in the destruction of tropical forests. Hundreds of thousands of acres of tropical forests in Brazil, Guatemala, Costa Rica, and Honduras, to name just a few countries, have been leveled to create pasture for cattle. According to other studies, 80% of deforestation of the Amazon is happening in Brazil and cattle ranching are the driving reason. 13 Since most of the forest is cleared by burning, the extension of cattle pasture also creates carbon dioxide and contributes significantly to global warming. 14
The annual rate of deforestation in the Amazon region has continued to increase from 1990 to 2003 because of factors at local, national, and international levels. 15 70% of formerly forested land in the Amazon, and 91% of land deforested since 1970, is used for livestock pasture. 16 According to the Center for International Forestry Research (CIFOR) between 1990 and 2001 the percentage of Europe’s processed meat imports that came from Brazil rose from 40 to 74 percent and by 2003 for the first time ever, the growth in Brazilian cattle production, 80 percent of which was in the Amazon was largely export driven 17.
The aforementioned FAO report also affirms that raising animals for food — including land used for grazing and land used to grow feed crops — now uses one third of the Earth’s land mass. A major environmental concern known as topsoil erosion occurs when the topsoil layer is blown or washed away. Without topsoil, little plant life is possible. Industrial farming encour- ages the depletion of topsoil because the soil must be plowed and replanted each year for feed production.
We are in an era of unprecedented threat to biodiversity. The loss of species is estimated to be running 50 to 500 times higher than background rates found in the fossil record. 18 15 out of 24 important ecosystem services are assessed to be in decline. 19 Conservation International has identified 35 global hot-spots for biodiversity, characterized by exceptional levels of plant en- demism and serious levels of habitat loss, of which 23 are reported to be affected by livestock production. 20 An analysis of the authoritative World Conservation Union (IUCN), Red List of Threatened Species, shows that most of the world’s threatened species are suffering habitats loss where livestock are a factor. 21 This is still happening everywhere in the world, especially in South America, 22 while the population and demand on beef keep growing.
Water
Seckler et al stated already in 1999 that ‘nearly 1.4 billion people, amounting to a quarter of the world’s population, or a third of the population in developing countries, live in regions that will experience severe water scarcity within the first quarter of the this century. Slightly more than one billion people live in arid regions that will face absolute water scarcity by 2025. About 348 million more people face severe economic water scarcity. They live in regions where the potential water resources are sufficient to meet reasonable water needs by 2025, but they will have to embark on massive water development projects, at enormous cost and pos- sibly severe environmental damage, to achieve this objective.’ 23
Virtual water refers to the water used in the production of a good or service. Hoektra et al. made a comprehensive table of virtual water content of a few selected products that clearly shows the larger virtual water by livestock. 24

Virtual water content of a few selected products in m3/ton. Estimates by different authors
*The figures given represent global averages.
** Unless stated otherwise, the data refer to a study for California.
***Data refer to Japan.
The aforementioned FAO report affirms that ‘the livestock business is among the most damaging sectors to the earth’s increasingly scarce water resources, contributing to water pollution, eutrophication and the degeneration of coral reefs. 25 The major polluting agents are animal wastes, antibiotics and hormones, chemicals from tanneries, fertilizers and the pesticides used to spray feed crops. Widespread overgrazing disturbs water cycles, reducing replenishment of above and below ground water resources. Significant amounts of water are withdrawn for the production of feed.’
Energy
The world population is 7 billion today, and there will be as many as 10 billion in the world in near future. 26 Moreover, we are getting 4.2 million more every single month on this planet, which is approximately 10 more whole Finnish population annually. All things considered, calorific efficiency and energy use in terms of food supply comes into play in a very significant way for the welfare of future generations.

Energetic efficiencies for a few representative food items derived from land animals, aquatic animals, and plants 27
A. Energy input refers to fossil fuels 28
B. Assuming 1 gram protein = 4 kcal and using U.S. Department of Agriculture (2005) value
C. For animal products, the product of the previous two columns
Grain-fed beef requires thirty-five calories for every calorie of beef produced not includ- ing the energy used in processing and transporting food.1 Given the current animal farming practices are highly dependant on synthetic fertilizer made out of natural gas, the calorific efficiency will be increasingly important as the fossil fuel is depleting.
Fossile Fule Usage
The biggest share of fossil fuel usage in industrial farming is not transporting food or fueling machinery, but chemicals. As much as forty percent of energy used in the food system goes towards the production of artificial fertilizers and pesticides. 29 Fertilizers are synthesized from atmospheric nitrogen and natural gas, a process that takes a significant amount of energy. Producing and distributing them alone requires an average of 5.5 gallons of fossil fuels per acre 30 — approximately 1 liter for every 200 square meter.
Manure could be a more energy-efficient alternative to synthetic fertilizers, but because it is heavy this applies only when it can be used a short distance from where it is produced — and our industrial system precludes this option. 31 The problem is over-consolidation: We raise large numbers of livestock in one place and raise the grain they eat in other places. This means that the livestock produce an excess of manure where there’s no cropland for it to be spread on, making it a pollutant rather than a tool. Meanwhile, the fields that grow feed must draw their fertility from synthetic sources. 32 We end up with concentrations of unusable manure in one place, and concentrations of chemical fertilizers in the other — and a whole lot of fuel wasted trucking feed and fertilizer around the country.
Health
Let alone the manure found in burger patty — and the consequences of it such as Escherichia coli O157:H7 (E. Coli) — and bovine spongiform encephalopathy (mad cow disease), exces- sive meat and dairy consumption directly and indirectly contributes to obesity, type 2 diabetes, cardiovascular disease, and osteoporosis. A recent study in Harvard conducted by Pan et al. 33 — an outcomes from more than 37,000 men from the Harvard Health Professionals Follow-Up Study and more than 83,000 women from the Harvard Nurses Health Study who were followed up for almost 3 million person-years — shows that consumption of both processed and unprocessed red meat is associated with an increased risk of premature mortality from all causes as well as from cardiovascular disease and cancer. In a related study by Pan et al., red meat consumption was also associated with an increased risk of type 2 diabetes mellitus. 34
The health risks from climate change are the topic of increasing research attention and policy development. According to by Lancet, the most respected peer-reviewed general medical journals, climate change is the biggest global health threat of the 21st century. ‘Health risks result from physical hazards, temperature extremes, effects on air quality, altered patterns of transmission of infectious diseases, and effects on food yields. Population displacement and conflict are also likely, because of various factors including food insecurity, desertification, sea-level rise, and increased extreme weather events.’ 35
Food Security
It is clear that the more we rely on animal products, the higher the chance to risk the food security. Factory farming is leading to health problems in the animals that are so closely packed together and pressures to cut costs are resulting in shortcuts being taken. The increase in phenomena like mad cow disease and aphtae epizooticae (foot-and-mouth or hoof-and-mouth disease) epidemic, largely starting in Britain but also seen in other places around the world is also a result of taking ‘short cuts’ in agriculture/food production. 36
The world is using more antibiotics than ever that treats the intestinal infections that are rou- tine in closely confined farm animals, and that calories that normally would have been con- sumed by the immune system were going instead to make bigger muscles and bones as much as 50%. 37 Because many livestock farmers still routinely dose their animals with antibiotics, pathogens such as salmonella are becoming more resistance to antibiotics, thus harder to kill. 38 Decades of heavy subtheraputic antibiotic use by livestock producers, which now accounts for nearly half of all antibiotics used worldwide, has produced numerous new strains of bacteria that are immune to entire classes of antibiotics, which means that some of the most common and inexpensive antibiotics can no longer treat humans infected by these resistant food-borne pathogens. 39 The better answer to the pathogens that are gaining more and more resistance seem to be less concentrated production, and more importantly, less consumption rather than breakthrough, stronger antibiotics.
Finland
Relative to other nations, carbon neutrality is low hanging fruit for Finland and only requires a 50 per cent carbon emission reduction. In doing so, reducing meat consumption, especially beef, is imperative for Finland just like any nation. Finnish education, known for its excellence and efficiency, has become its national export. In near future the knowledge of Finland in reducing beef consumption, along with others of carbon neutrality, can also be another national export in a world shared by 7 billion people and more.
Agriculture in Finland at a glance
Food security of Finland among other Nordic European nations has been heavily dependant upon dairy as its climate and soils make growing crops particularly challenging. The country lies between 60° and 70° north latitude, and has severe winters and relatively short growing seasons. However, Finland contains half of the world’s arable land north of 60° north latitude. Annual precipitation is usually sufficient, but it occurs almost exclusively during the winter months, making summer droughts a constant threat.
Climatic summers of the southern Finland last 4 months. In northern Finland, particularly in Lapland, a subarctic climate dominates, characterized by cold — occasionally severe – winters and relatively warm, short summers. Winters in north Finland are nearly 7 months long, and snow covers the lands almost 6 months. Summers in the north are quite short, only 2 to 3 months.
In response to the climate, farmers have relied on quick-ripening and frost-resistant varieties of crops, and they have cultivated south-facing slopes as well as richer bottom lands to ensure production even in years with summer frosts. Most farmland had originally been either forest or swamp, and the soil had usually required treatment with lime and years of cultivation to neutralize excess acid and to develop fertility. Irrigation was generally not necessary, but drain- age systems were often needed to remove excess water.
Meat consumption in Finland
Finland consumed 71.26 kg of meat per capita in 2007 40 that is less than the other European nations such as Spain (111.79 kg), France (88.77 kg),1 but almost double of what the dietary experts recommends — 60 to 100 g per day — worldwide.

Finland Meat, and Dairy kg / capita / year compared to other regions. Source: FAO Statistics
Perhaps surprisingly jauheliha (ground beef) constitutes the majority of Finnish beef consumption, which has become progressively affordable owing to the shortened breeding cycle as well as the Finn- ish dairy consumption that is higher than almost any other nation. The shortened breeding cycle has taken place for various reasons: increased input costs; enhanced milk productivity due to breeding system and altered feed composition; fixated market price. Many misunder- stand that the beef consumption has been decreasing and beef in Finland comes from only certain area, but any dairy farm in Finland is also beef farm as all the dairy cattle are being used as minced meat.
Minced meat is popular also because of its versatility and convenience — to cook laatikko (oven casserole), meatball, burger, et cetera — naturally become the most common menu in restaurants and canteens. Popularity of laatikko, which usually required a large quantity of cream or cheese to cook, has to do with high gender equity of Finnish society where working mom has been a long tradition, as well as the food culture in which warm dish is considered proper meal. There are about ten or more variety of laatikko, and the biggest advantage of it is preparation time, and Finnish parents want to prepare the meal themselves even if it’s simply putting ready-cut meat and vegetables in a oven ware.
Breeding Cycle and More Greenhouse Gas
Today cattle in Finland are largely fed on imported soy and grain that enhance milk produc- tivity but exhaust the animal, and therefore to be slaughtered only after two or three calving periods. Over the past decades, the average breeding cycle has become shorter from 10-15 years to 4-5 years. The average dairy farm size has dramatically increased while the number of farms decreased while many of the cattle farms have been moving to the south as it makes more economical sense to be closer to the shore for imported soy and crop.
Shortened breeding system has a greater contribution to climate change due to the increased overlaps. It takes about two years for a calf to be mature to produce milk. Soy and grain based feed also means more greenhouse gas emission and altered fatty acid composition that proves to be less healthy than traditional composition. Even in the old days Butter was softer in the summer than in the winter because cattle were fed mostly on grass in the summer and more on other feed in the winter. Only about 5% of whole dairy production keeps the traditional grass feed. Today farmers try to alter the enhance fatty acid composition by providing the animal with rapeseed press cake while keeping soy and crop based feed.

Comparison of overlaps between Breeding Cycles of 5 years and of 10 years in 20 years time frame. The darker areas represents the two years the newly born calves become mature to produce milk.
Meat from young dairy cattle also means lower quality beef, which is why we eat them as minced meat while importing beef from South America. According to Aki Arjola, a cofounder of a leading organic grocery chain in Helsinki, the beef from older dairy cattle produces much tastier steak parts than that of a young beef cattle.
Unhealthy Nation, Soaring Costs
Finns are not very healthy — approximately half of men and 40% of women are overweight in Finland. 41 We have a large number of obesity, type 2 diabetes and cardiovascular diseases, which have been parallel with increasing consumption of meat. Taken together, the health- care costs are being more and more burdensome. The prevalence of overweight is higher in the older age groups than in the younger groups. The prevalence of overweight differs also by educational level, especially among women: lower educated women are more often over- weight compared to their higher educated counterparts.2
There are estimated to be about 150,000 people with diabetes in Finland, about 23,000 of whom have type I diabetes (an incidence of almost 40 per 100,000 population). Type I diabetes, which usually emerges in childhood or adolescence, is more common in Finland than in any other country in the world. The incidence of Type 2 diabetes is also fairly high compared to other western countries. It has been estimated that the prevalence of diabetes in adulthood has grown ten-fold and the number of persons suffering from the disease has grown over twenty-fold in the last fifty years. 42
Recently, the increasing prevalence of type 2 diabetes has been notified as a major current public health problem in Finland. As a result the National Programme for the Prevention of Type 2 Diabetes 2003 — 2010 (DEHKO) was set up. The programme was coordinated by the Finnish Diabetes Association and a wide variety of other relevant organizations are participating. The programme comprises three concurrent strategies: the Population Strategy aimed at promoting the health of the entire population by means of nutritional interventions and increased physical activity so that the risk factors for type 2 diabetes, such as obesity and metabolic syndrome, are reduced in all age groups; High-Risk Strategy comprises measures targeted at individuals at particularly high risk of developing type 2 diabetes, providing a sys- tematic model for the screening, education and monitoring of people at risk; the Strategy of Early Diagnosis and Management is directed at persons with newly diagnosed type 2 diabetes with the aim of bringing these people into the sphere of systematic treatment, thus preventing the development of diabetic complications that reduce the affected person’s quality of life and are expensive to manage. 43
The estimated direct costs of both types of diabetes is € 3.3 billion with additional costs of some € 1.8 billion, which are staggering figures considering that the Finnish state budget is approximately € 55 billion. Moreover, these costs come mostly from type 2 diabetes that costs about € 530 per patient per year in a non-complicated disease. Additional complications brings this cost up to € 10,700 per year per diabetic patient. 44
Metabolism
Metabolism refers to the chemical processes that occur within a living organism in order to maintain life. Bovine animals, for example, can eat and survive grass while we mankind can- not. Difference of metabolism in same species also shows geographical implications. Small intestine of Asians, for example, is known to be longer than that of the others that makes boiled vegetables easier for Asians for digestion.
It was discussed with experts whether the Finnish population among Nordic Europeans can consume more meat and dairy without getting related diseases such as cardiovascular, type 2 diabetes or osteoporosis. Disappointingly there was no such thing but lactose tolerance and the Finnish genes that are known to be vulnerable to osteoporosis.
Dairy farming has been an integral part of Finnish agriculture since prehistoric times and milk has been the major agricultural product of Finland, which is well manifested by lactose tolerance found in majority of its Finnish population. Perhaps surprisingly, lactose toler- ance is an “abnormal” condition. Worldwide children under 10 years old are usually lactose tolerance and gradually become intolerant becoming adults. 45 It was a useful genetic mutation for people in Nordic Europe where the climate and solis make growing crops particularly challenging, which took place between 5,000 to 12,000 years ago. Most Africans and Asians are lactose intolerant while more than 80% of Europeans are lac- tose tolerance.
According to the The Finnish Dairy Council, Finnish nutrition recommendations favor dairy products but not the fat in them. It is advised to have half a liter of liquid dairy products, skimmed or low-fat, and 2-3 slices of low-fat cheese daily to meet our nutrient needs. Skimmed milk or low-fat fermented milk are recom- mended drinks with meals. All schools in Finland have been serving a warm meal free of charge daily, regu- lated by law for 60 years already, and the meals include free milk, fermented milk and water as a drink in every school. 46
According to FAO’s Statistical Service, Finland in 2007 consumed 361.19 kg excluding butter, more milk per capita than any other nation on this planet, and it has never gone below 300 kg since 1960 while Iceland, once-biggest consumer back in 60’s, has come down to 223.68 kg. 47

Systems map of Finnish beef consumption [View larger map]
Dietary Recommendation
The National Nutrition Council of Finland (VRN) has already since 1954 monitored the nutrition and health of Finnish people and issued nutritional recommendations aimed at im- proving their status. Initially the Council focused on eliminating nutritional deficiencies, but in the recent decades the major challenge has changed into reducing health problems caused rather by the overabundant consumption of food or unhealthy food. 48
The Finnish nutrition recommendation is based on the Nordic Nutrition Recommendation (NNR) made by the Nordic Food Policy Cooperation that consists of experts from the member countries and autonomous territories of The Nordic Council. The Council has 87 elected members from Denmark, Finland, Iceland, Norway and Sweden as well as from the Faroe Islands, Greenland and Åland. The current Finnish nutrition recommendations have been renewed in 2005. They are based on the new Nordic Nutrition Recommendations which were approved in 2004 by the Nordic Council of Ministers, and we are expecting the fifth edition by the end of this year or the beginning of 2013 as NNR is published every eight years. It’s in a very extensive review process by a large number of experts, and some parts of work in progress of today is being shared on the website. We will be able to see some of the contents at the 10th Nordic Nutrition Conference hosted in Reykjavik, June 3-5, 2012.
Raija Kara, the only full-time employ of VRN, works with roughly 20 members from various field. The National Nutrition Council is an expert body under the Ministry of Agriculture and Forestry. The Council members represent authorities dealing with nutrition matters, consumer, advisory and health promotion organizations as well as organizations from the fields of industry, commerce and agriculture, and they are elected for a period of three years. The term of office of the current Council is from 4 October 2011 to 3 October 2014. The tasks of the National Nutrition Council are defined in the relevant Appointment Decision, which occurs roughly every quarter.
From Nutrition to food
While NNR’s recommendation is mostly based on nutrition — e.g. vitamins and minerals — VRN translate the information to food-based recommendations according to the Finnish food culture, availability, and the current situation. The nutrition recommendation is somewhat standard all over the world, but what is available and what people enjoy are hugely different in different countries. For example, people in Korea do not consume as much dairy as the Finnish people but consume much more rice. So, if one looks at the food pyramid in different countries, they look all different although contain mostly the same food groups.

The food plate model by VRN 49
VRN created a plate model that exemplifies typical meals in Finland for home settings and canteen settings, so that people can easily see that how much vegetable, crops, meat or fish, and drink they need to take. The general principle is to fill one half of the plate with vegetables, one quarter with potatoes/ rice/ pasta and one quarter with meat/ fish/ eggs/ legumes and complete the meal wit low fat milk, whole-grain bread with vegetable oil-based spread and fruits/ berries.
Vegetarianism
About 0.5 to 3 percent of the adult population in Finland appears to vegetarian depending on the definition. 50 There are several vegetarianism and all of them can be perfectly healthy choices. Veganism, although some vitamins shall be substituted, for example by taking pills, also is a perfectly health dietary choice. When turning vegetarian or vegan one needs to be well informed about which nutritions he or she will be missing by not taking certain or all animal products anymore to substitute them sufficiently.
North Karelia Project 51
There have been several major public health campaigns in Finland to reduce mortality and risk factors related to chronic disease. For example, in 1972, the North Karelia Project was launched in the eastern province of North Karelia in response to a local petition to reduce the high coronary artery disease mortality rates among men. 52 The North Karelia Project was launched as a community-based, and later as a national, programme to influence diet and other lifestyle factors that are crucial in the prevention of cardiovascular diseases. The original project period lasted from 1972 to 1977, but it continued operating beyond this period until the end of the 90’s. The prevalence of cardiovascular diseases among men in the eastern parts of Finland was higher than in other parts of the country and was one of the highest in the world. In cooperation with local and national authorities and experts, as well as with WHO, the project was designed and implemented to carry out comprehensive interventions through community organizations in the area, and the actions of people themselves. The project was integrated as far as possible into the local service system and social networks.
Various methods were used in the project: provision of general information and health education (through materials, mass media, meetings, campaigns, etc.); Development of referral and screening procedures in health services; encouragement of environmental changes (such as smoking restrictions, promoting vegetable growing, collaborating with food manufacturers); preventive work directed at children and young people; and training and education of health personnel. Much of the practical work was carried out by various bodies in the community itself, coordinated by hospitals and health centres.
Over the 25-year period since the start of the project, major changes have taken place. Among men in North Karelia, smoking has greatly reduced and dietary habits have mark- edly changed. In 1972, a little more than half of middle-aged men in North Karelia smoked. In 1997 the percentage had fallen to less than a third. By 1995 the annual mortality rate of coronary heart disease among men under 65 years old was reduced by about 73% from the pre-programme years. 53 Among women, the reduction in deaths from cardiovascular diseases has been of similar magnitude. Broad community organization and the strong participation of people were the key elements of the success of the programme.
Heart Symbol by Finnish Heart Association
 With one glance, the Heart Symbol shows you that the product is a better choice in its product line, based on the content of fat and salt, as well as on the quality of fat. However, it does not guarantee that the product is healthy in every way, that you can eat it as much as you want or that it is necessarily a beneficial health product. On the other hand, products that haven’t been granted a Heart Symbol are not necessarily less healthy choices.
Even though a single ingredient obviously does not make one’s diet substantially more or less healthy, individual choices do ultimately make a difference, since any diet is composed of many choices after one another. The Heart Symbol helps consumers choose products that promote a healthier diet, at least in regards to the content of fat and salt. A balanced and rich diet includes daily a lot of vegetables, berries and fruits, enough whole-grain products, moderate amounts of skimmed or low-fat dairy products, fish or low-fat meat and moderate vegetable fat such as oils and margarines. 54
Herttoniemi food co-operative
A novel idea is being run by the Herttoniemi Organic Food Collective, which also operated a pop up village store selling local and organic goods in Herttoniemi in September 2012. The food collective was established on the back of the Herttoniemi Food Circle, which started in 2010. Having started as a group of like-minded friends, the food circle has gained around 300 members in just under a year. Members make food orders by email and can pick up their produce once a week. Organic products are ordered directly from producers without middle men or food wastage. The Herttoniemi Organic Food Collective consists of around 200 members who grow root vegetables, greens and herbs on a rented field in Korso, Vantaa. The collective employs a gardener, but most of the work is done voluntarily by the members. 55
References
- IPCC, Climate Change 2007: The Physical Science Bases. Contribution of Working Group I to the Fourth Assessment Report, Cambridge University Press, Cambridge, 2007, p.13 & pp. 539-542. ↑
- J McCarthy, OF Canziani, NA Leary, DJ Dokken & KS White (ed.), Climate Change 2001: Impacts, Adaptation and Vulnerability, Cambridge University Press, Cambridge, 2001 ↑
- T Tanner & J Allouche, Towards a New Political Economy of Climate Change and Development, IDS Bulletin. 32 (3), 2011, pp. 1-14. ↑
- Y Malhi, JT Roberts, RA Betts, TJ Killeen, W Li & CA Nobre, Climate Change, Deforestation, and the Fate of the Amazon, Science, 319, 2008, pp. 169-172. ↑
- IPCC, loc. cit. ↑
- N Stern, The Economics of Climate Change: The Stern Review, Cambridge University Press, New York, 2007, pp. 65-68. ↑
- LEAD (Livestock, Environment and Development), Livestock’s Long Shadow: Environmental Issues and Options, FAO (Food and Agricultural Organization of the UN), Rome, 2006. ↑
- US Department of Energy, Annual energy review 2003, Rep. DOE/EIA-0384(2003), Energy Information Administration, p. 390. ↑
- R Goodland & J Anhang, Livestock and Climate Change: What if the key actors in climate change are cows, pigs, and chickens?, World Watch, November/December 2009, Washington DC, 2009. ↑
- M Hickman, ‘Study claims meat creates half of all greenhouse gases’, The Independent, 1 November 2009, re- trieved 28 November 2011, link. ↑
- A Leip, F Weiss, T Wassenaar, I Perez, T Fellmann, P Loudjani, F Tubiello, D Grandgirard, S Monni & K Biala, Evaluation of the livestock sector’s contribution to the EU greenhouse gas emissions (GGELS), European Commission, Joint Research Centre, 2010, p. 18. ↑
- J Gillis, ‘As Permafrost Thaws, Scientists Study the Risks’, The New York Times, 16 December 2011, retrieved 6 April 2012, link. ↑
- Y Malhi, JT Roberts, RA Betts, TJ Killeen, W Li & CA Nobre, Climate Change, Deforestation, and the Fate of the Amazon, Science, 319, 2008, pp.169-172. ↑
- R Robbins, Global Problems and the Culture of Capitalism, Allyn and Bacon, Boston, 1999, p. 220. ↑
- KR Kirby, WF Laurance, AK Albernaz, G Schroth, PM Fearnside, S Bergen, EM Venticinque & CD Costa, The future of deforestation in the Brazilian Amazon, Futures of Bioregions, 38, 2006, pp. 432-453. ↑
- S Marglis, Causes of Deforestation of the Brazilian Amazon, World Bank Working Paper, No. 22, The World Bank, 2004. ↑
- D Kaimowitz, B Mertens, S Wunder & P Pacheco, Hamburger Connection Fuels Amazon Destruction: Cattle ranching and deforestation in Brazil’s Amazon, Centre for International Forestry Research (CIFOR), 2004, p. 3. ↑
- LEAD (Livestock, Environment and Development), Livestock’s Long Shadow: Environmental Issues and Options, FAO (Food and Agricultural Organization of the UN), Rome, 2006. ↑
- LEAD, loc. cit. ↑
- LEAD, ibid. ↑
- LEAD, ibid. ↑
- S Romero, ‘Vast Tracts in Paraguay Forest Being Replaced by Ranches’, The New York Times, 25 March 2012 ,
retrieved 25 March, link. ↑ - D Seckler, D Molden & R Barker, Water Scarcity in the Twenty-First Century, International Water Management
Institute (IWMI), Colombo, 1999. ↑ - AY Hoekstra (Ed), Virtual Water Trade Proceedings of the International Expert Meeting on Virtual Water Trade, Value of Water Research Report Series No. 12, IHE Delft, Delft, 2003. ↑
- LEAD (Livestock, Environment and Development), Livestock’s Long Shadow: Environmental Issues and Options, FAO (Food and Agricultural Organization of the UN), Rome, 2006. ↑
- B Crossette, R Kollodge, R Froseth, W Haug, A Toure, S Wong, R Kollodge & R Puchalik, The State of World Population 2011: People and Possibilities in a World of 7 Billion, Information and External Relations Division, the United Nations Population Fund (UNFPA), New York. ↑
- G Eshel & PA Martin, Diet, Energy, and Global Warming, Earth Interactions, Vol. 10, Paper No. 9, 2005, p. 6. ↑
- D Pimentel, and M Pimentel, Energy use in livestock production. Food, Energy and Society, University Press of Colorado, 1996, pp. 77-84. ↑
- MC Heller, AK Gregory, Life Cycle-Based Sustainability Indicators for Assessment of the U.S. Food System, Ann Arbor, MI: Centre for Sustainable Systems, University of Michigan, 2000, p. 40. ↑
- R Manning, ‘The Oil We Eat: Following the Food Chain Back to Iraq’, Harper’s, 23 July 2004, retrieved 20 March 2012, link. ↑
- C Heeter, The Oil in Your Oatmeal: A Lot of Fossil Fuel Goes into Producing, Packaging and Shipping Our Breakfast, San Francisco Chronicle, 26 March 2006, retrieved 29 March 2012, link. ↑
- K Clancy, Greener Pastures: How Grass-fed Beef and Milk Contribute to Healthy Eating, Union of Concerned Scientists, Cambridge, 2006, p. 13. ↑
- A Pan, Q Sun, AM Bernstein, MB Schulze, JE Manson, MJ Stampfer, WC Willett & FB Hu, Red Meat Consumption and Mortality: Results From 2 Prospective Cohort Studies, American Medical Association, doi: 10.1001/archintern- med.2011.2287. ↑
- A Pan, Q Sun, AM Bernstein, MB Schulze, JE Manson, WC Willett & FB Huh, Red meat consumption and risk of type 2 diabetes: 3 cohorts of US adults and an updated meta-analysis, The American Journal of Clinical Nutrition, 2011;94(4):1088-1096. ↑
- AJ McMichael, JW Powles, CD Butler & R Uauy, Food, livestock production, energy, climate change and health, Lancet, 2007; 370: 1253-63, DOI:10.1016/501406736(07)61256-2. ↑
- E Schossler, Fast Food Nation; The Dark Side of the All-American Meal, Boston, Houghton Mifflin Company, New York, 2001, pp.197-202. ↑
- P Roberts, The End of Food, Houghton Mifflin Harcourt Publishing, New York, pp. 3-5. ↑
- Ibid., P. xvi. ↑
- Ibid., p. 185. ↑
- Meat Consumption (Total, kg/capita/yr), FAOSTAT: on-line Statistical Service of Statistics Division of FAO, Food and Agriculture Organization of the United Nations, Rome, retrieved 19 May 2011, link. ↑
- Overweight and obesity, National Institute for Health and Welfare THL, retrieved 29 March 2012, link. ↑
- J Järvelin (Ed.), A Rico & T Cetani, Health Care Systems in Transition, The European Observatory on Health
Care Systems, Vol. 4. No. 1, 2002, p. 10. ↑ - Finland (2008), World Health Organization WHO, retrieved 29 March 2012, link. ↑
- E Vartiainen, Sydän- ja verisuonisairauksien ja diabeteksen asiantuntijaryhmän raportti 2008, Kansantervey- slaitos, Terveyden edistämisen ja kroonisten tautien ehkäisyn osasto, Helsinki, 2008, pp. 15-16. ↑
- CJ Ingram, CA Mulcare & Y Itan, Lactose digestion and the evolutionary genetics of lactase persistence, Hum Genet,124(6), pp. 579 — 591, Springer. ↑
- Milk in Finland, The Finnish Dairy Council, 20 March 2012, link. ↑
- Milk Consumption Excluding Butter (Total, kg/capita/yr), FAOSTAT: on-line Statistical Service of Statistics Division of FAO, Food and Agriculture Organization of the United Nations, Rome, retrieved 19 May 2011, link. ↑
- The National Nutrition Council of Finland VRN, retrieved 7 March 2012, link. ↑
- Ibid. ↑
- M Vinnari, J Montonen, T Härkänen & S Männistö, Identifying vegetarians and their food consumption according to self-identification and operationalized definition in Finland, Public Health Nutrition: 12(4), 481-488, doi:10.1017/ S1368980008002486, Cambridge Journal, 2008. ↑
- World Health Organization WHO, loc. cit. ↑
- P Puska, E Vartiainen, T Laatikainen, P Jousilahti & M Paavola (Ed.), The North Karelia Project: From North Karelia to National Action, National Institute for Health and Welfare THL, Helsinki, 2009. ↑
- P Puska, P Pietinen, U Uusitalo, Influencing public nutrition for non-communicable disease prevention: from community intervention to national programme — experiences from Finland, Public Health Nutrition, 2002, 5(1a):245 — 251. ↑
- Suomen Sydänliitto ry, retrived 29 March 2012, link. ↑
- World Design Capital Helsinki 2012, Local food for helsinki locals!, retrieved 29 March 2012, link. ↑